New publication: Investigating the Analytical Robustness of the Social and Behavioural Sciences
Citation
Aczel, B., Szaszi, B., Clelland, H.T., et al. (including González-Bustamante, B.) (2026). Investigating the analytical robustness of the social and behavioural sciences. Nature, 652, 135–142. https://doi.org/10.1038/s41586-025-09844-9.
Abstract
The same dataset can be analysed in different justifiable ways to answer the same research question, potentially challenging the robustness of empirical science. In this crowd initiative, we investigated the degree to which research findings in the social and behavioural sciences are contingent on analysts’ choices. We examined a stratified random sample of 100 studies published between 2009 and 2018, in which, for one claim per study, at least five reanalysts independently reanalysed the original data. The statistical appropriateness of the reanalyses was assessed in peer evaluations, and the robustness indicators were inspected along a range of research characteristics and study designs. We found that 34% of the independent reanalyses yielded the same result (within a tolerance region of +/-0.05 Cohen’s d) as the original report; with a four times broader tolerance region, this indicator increased to 57%. Of the reanalyses conducted, 74% reached the same conclusion as the original investigation, 24% yielded no effects or inconclusive results and 2% reported the opposite effect. This exploratory study indicates that the common single-path analyses in social and behavioural research should not be simply assumed to be robust to alternative analyses. Therefore, we recommend the development and use of practices to explore and communicate this neglected source of uncertainty.
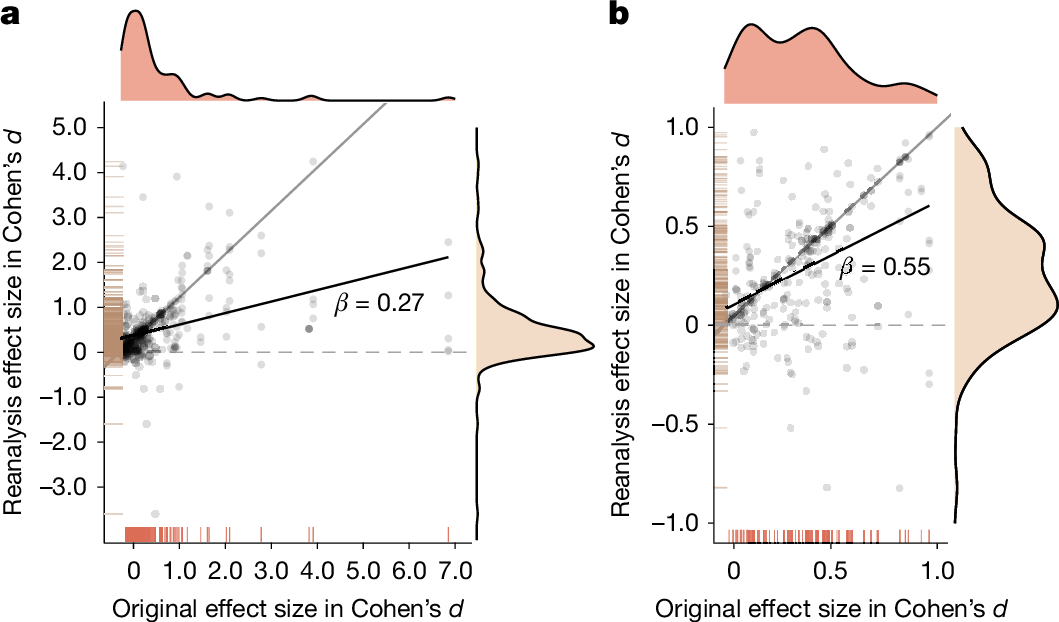
Key highlight
Rreanalysis data trimmed at Cohen’s d ≤ 5 and d ≤ 1, respectively, indicates that reanalysis effect sizes show a tendency to be smaller than the original effect sizes, as reflected in their best-fitting (least-squares) line. The distribution of original and reanalysis effect sizes also supports this, because the peak of the density distribution of the latter is markedly lower. The original results showed a mean effect size of 0.73 (median = 0.43), whereas the reanalysis yielded a mean effect size of 0.49 (median = 0.35), with Cohen’s d calculated for d values ≤ 5. This result is consistent with the possibility that the original authors were biased towards reporting larger effects than the reanalysts, that the reanalysts were biased towards reporting smaller effects than the original analysts, or both.